Ryan White HIV/AIDS Program Services Report (RSR) data are HRSA HAB’s primary source of annual, client-level data reported by more than 2,000 funded grant recipients and subrecipients. These de-identified, client-level data have been used since 2010 to assess RWHAP client characteristics and HIV-related outcomes. RSR data do not include information about the RWHAP AIDS Drug Assistance Program (ADAP); all ADAP-related information is reported through the ADAP Data Report (ADR).
The ADR includes client-level data about clients enrolled in ADAP. The ADR data have been used since 2014 and are reported by the 54 states and territories that receive ADAP funding. The ADR data do not include information about clients receiving non-ADAP RWHAP services, such as core medical and support services. However, many ADAP clients also receive these services.
It is important to note that neither the RSR nor ADR can track clients over time. Because these data are reported annually and de-identified, an individual client cannot be tracked across years.
Outcome Measures
The RWHAP relies on two primary outcome measures – viral suppression and retention in care.
- Viral suppression was based on data for people with HIV who had at least one outpatient ambulatory health services (OAHS) visit (i.e., a medical visit) during the measurement year. Among these clients, a client was considered “virally suppressed” if their last viral load test result in the calendar year was <200 copies/mL.
- Retention in care was based on data for people with HIV who had at least one OAHS visit (i.e., a medical visit) by September 1 of the measurement year. Among these clients, a client was considered “retained in care” if they had a second visit at least 90 days after.
How Percentages are Calculated
Screens that display the number of clients served (e.g., Characteristics of RWHAP Clients), include all RWHAP clients, regardless of HIV serostatus. This includes:
- Clients with HIV
- Clients for whom HIV serostatus was not reported
- Clients who do not have HIV (i.e., the families of people with HIV are able to receive certain RWHAP services)
Screens in the dashboard displaying outcome measure data (i.e., retention in care and viral suppression) include only people with HIV who also meet the denominator criteria for that specific outcome measure. Therefore, these outcomes represent a subset of all RWHAP clients. As a result, the number of people with HIV included in these outcome analyses are less than the total number of people served by the RWHAP. (See Technical Notes and Definitions for more information on outcome measure calculations.)
Note that some percentage calculations with non-zero numerators may be rounded to 0.0% for display purposes.
Geographic Regions
The dashboard displays information at national-, state-, and metropolitan area-levels. The RWHAP funds grants to cities (Part A); states (Part B); and cities, counties, and local community-based organizations (Part C and Part D), to provide care and treatment services to people with HIV. In particular, the RWHAP Part A provides funding to specific metropolitan areas that are most severely impacted by the HIV epidemic. The boundaries of these Eligible Metropolitan Areas (EMAs) and Transitional Grant Areas (TGAs) are based on the U.S. Census designations of Metropolitan Statistical Areas at the time when that jurisdiction first became an EMA or TGA and may span more than one state.
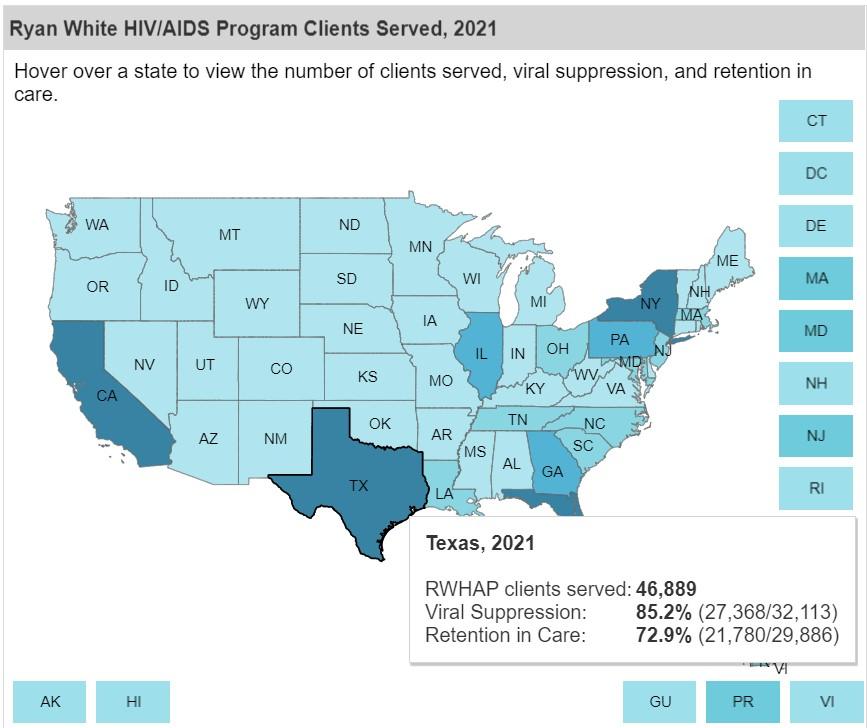
Selecting a state or metropolitan area will show data for that geographic region, regardless of the funding source (see Figure 2). That is, the data represented are not specific to any one RWHAP Part, regardless of the geographic area selected (i.e., state or metropolitan area). For example, selecting the state of Maryland would show information for all clients served by providers located in the state of Maryland across Part A, Part B, Part C, and Part D funding sources.
Figure 2
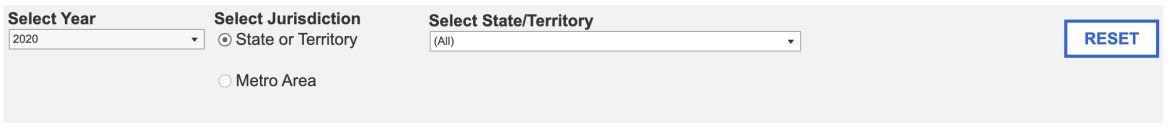
Filtering Data
Each screen has a set of filters at the top of the screen (see example below). Use these filters to customize the displayed data, including data year and jurisdiction. On certain screens, you can also select an outcome measure (e.g., viral suppression or retention in care) and filter based on demographic characteristics.
On screens with U.S. maps, click on a state or territory to access data for that jurisdiction. Use the reset button to clear your selections to return to the default view and start again.