The Health Resources and Services Administration’s (HRSA) Ryan White HIV/AIDS Program (RWHAP) funds grants to states, cities, counties, and local community-based organizations to provide HIV medical care, treatment, and essential support services for low-income people with HIV.
Recipients funded by the RWHAP differ in many important aspects, including the characteristics of the clients they serve. The RWHAP Compass Dashboard provides standardized performance tools to support jurisdictional comparison and evaluation.
Step 1: Standardized Outcome Measure
A statistical model is applied to the observed outcome measure (viral suppression or retention in care) that adjusts for key client characteristics.
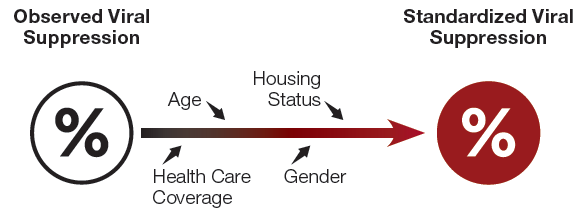
The Observed Outcome Measure is calculated based on data reported through the RWHAP Services Report.
The Standardized Outcome Measure is the expected rate given the age, gender, housing status, and health care coverage of the clients in this jurisdiction.
These four variables were chosen based on consultation with a panel of technical experts and previous work by the Centers for Medicare & Medicaid Services (CMS).*
Step 2: Standardized Performance Score
The observed outcome measure is compared to the standardized outcome measure to calculate the standardized performance score.
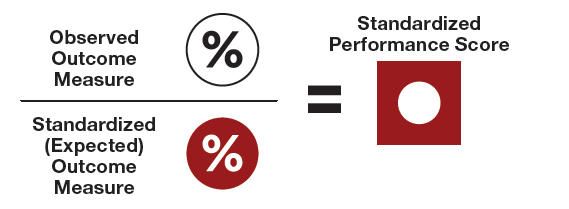
A jurisdiction with a score greater than one is performing better than expected, given the client populations they serve.
A jurisdiction with a score less than one is not meeting their expected performance, given the client populations they serve.
Step 3: Assign Range
Standardized Performance is reported as a quintile to demonstrate where a score falls within the range of all jurisdictions
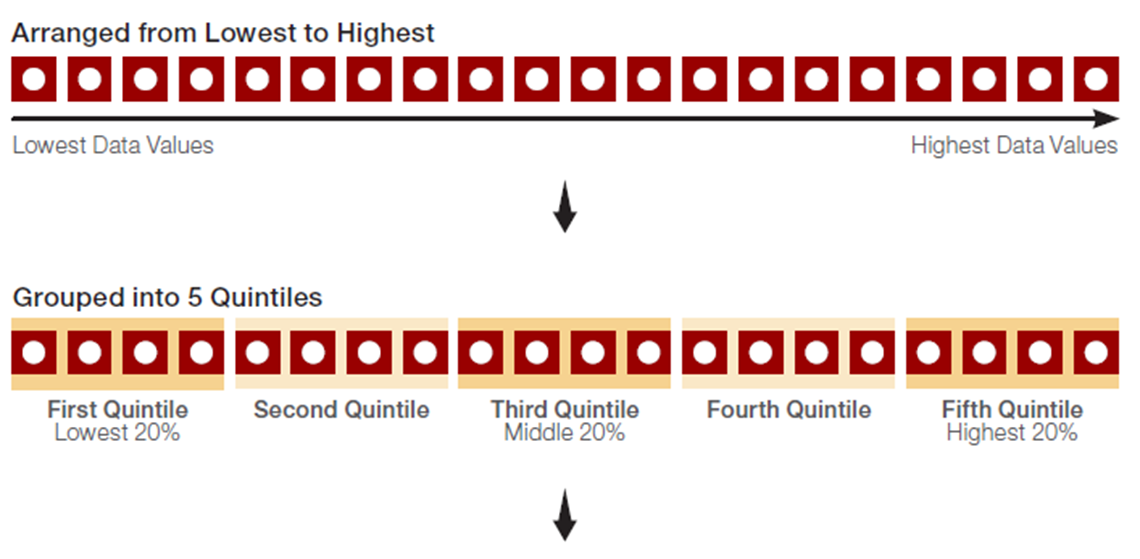
The standardized performance score is a tool to understand relative performance between jurisdictions.
A score in the first quintile is in the lowest 20%; a score in the third quintile is in the middle 20%; and a score in the fifth quintile is in the top or highest 20% of jurisdictions in the U.S.
Standardized Performance is displayed as a gauge on the RWHAP Compass Dashboard.
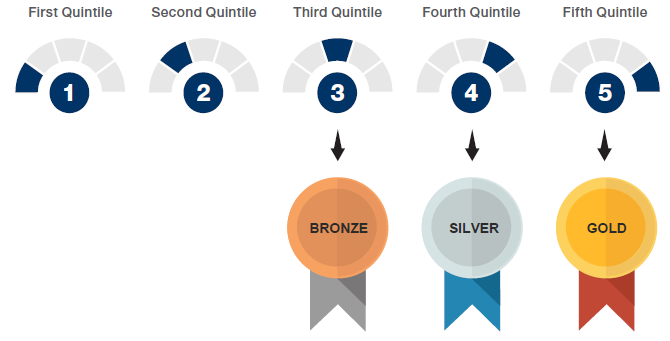
Jurisdictions in the top three quintiles display a badge. Standardized performance in the fifth quintile receives a gold badge, standardized performance in the fourth quintile receives a silver badge, and standardized performance in the third quintile receives a bronze badge.
*Krumholz, H.M., Normand, S.L.T., Galusha, D.H., Mattera, J.A., Rich, A.S., Wang Yongfei, Wang Yun. (2010). Risk-Adjustment Models for AMI and HF 30-Day Mortality Methodology, prepared for Centers for Medicare & Medicaid Services. Under subcontract #8908-03-02, February 2, 2010.