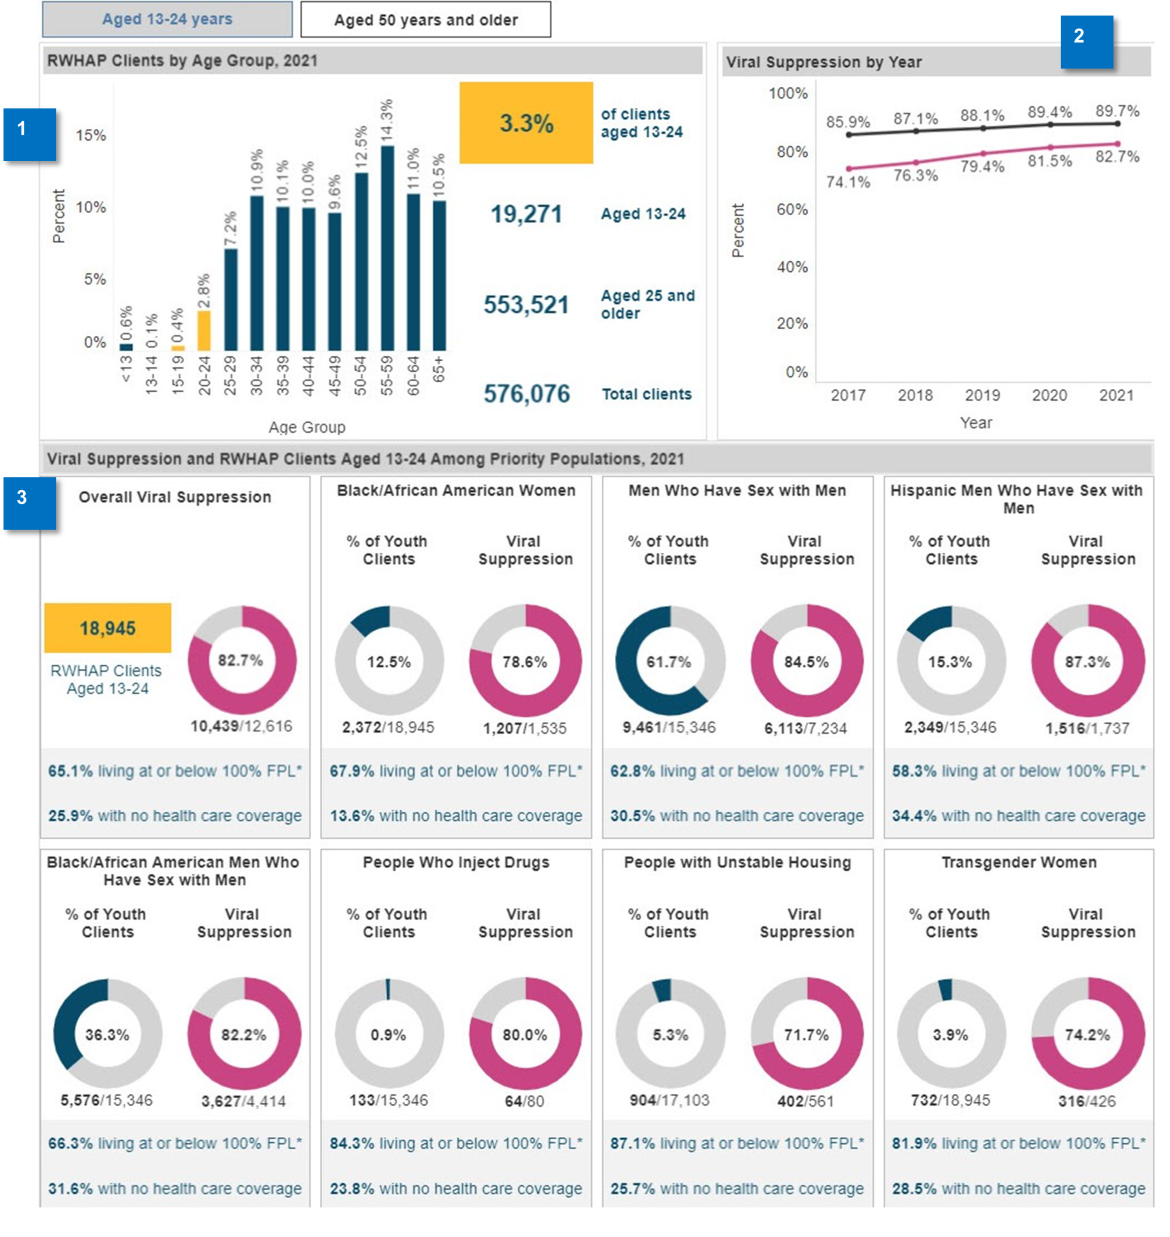
The Outcome Measures by Age screen (see Figure 7) shows the outcomes and client characteristics by age group, with a focus on youth (aged 13–24 years) and clients aged 50 years and older.
When the screen first loads, it displays the most recent national data for clients of all race/ethnicity categories and genders who are aged 13–24 years. Use the dropdowns in the filters panel to customize the data that is presented.
Figure 7
-
RWHAP Clients by Age
This bar chart contains a visualization of the defined population by age group. The age groups that fall within the selected age range (aged 13–24 years or aged 50 years and older) will be highlighted in yellow on the bar chart. To the right of the chart is a summary of data related to the selected age range. -
Outcome Measure by Year
This trend chart shows the outcome measure for the selected age range (aged 13–24 years or aged 50 and older) versus the national data for all age groups. -
Outcomes and RWHAP Clients by Age among Priority Populations
These small boxes compare viral suppression or retention in care of the selected age range (aged 13–24 years or aged 50 years and older) among various priority populations. They also show what percentage of clients makes up the selected age range and population to provide data regarding the size of each priority population.
This screen has two tabs that allow the view to be toggled between two age ranges: clients aged 13–24 years and clients aged 50 years and older (see example below).