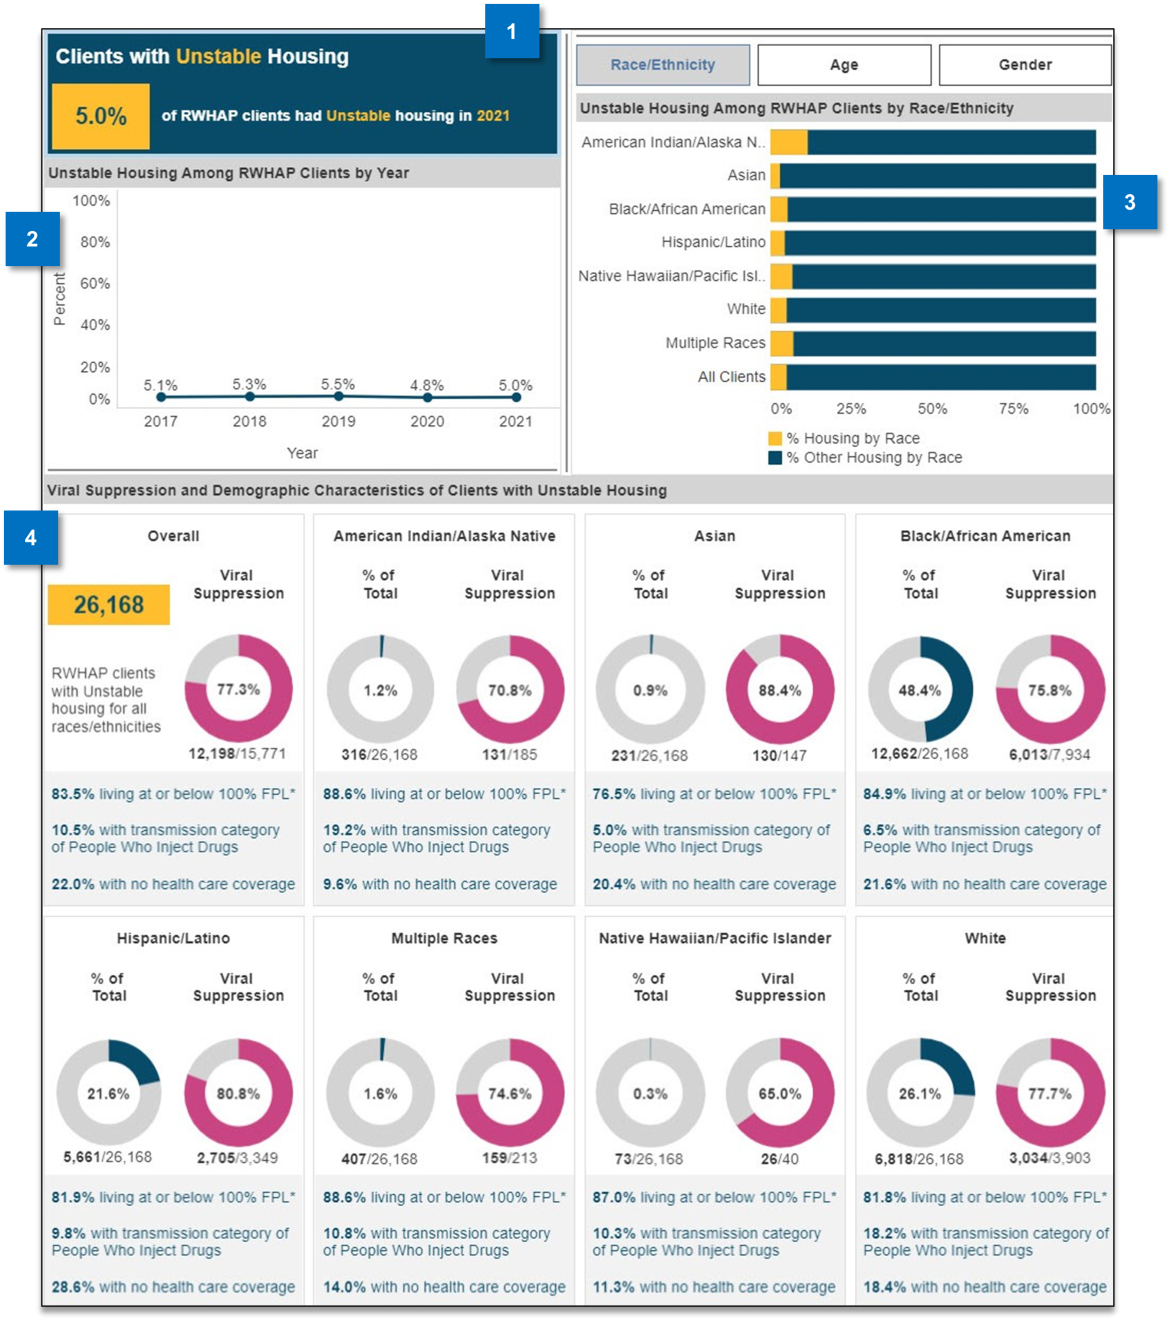
The Outcome Measures by Housing Status screen (see Figure 9) shows viral suppression and retention in care by housing status. It also explores how these outcome measures differ among priority populations. When the screen first loads, it displays the most recent national data for viral suppression among those with unstable housing. Select a different housing status from the dropdown menu to change the display.
Figure 9
-
Housing Status Summary
This box highlights the percentage of RWHAP clients within the selected population who reported having unstable housing. -
Housing Status among RWHAP Clients by Year
This chart shows the percentage of clients within the defined population who reported having the selected housing status over a five-year period. -
RWHAP Clients by Race/Ethnicity, Age, and Gender
These yellow bar graphs show the prevalence of the selected housing status within the selected population. Use the tabs above the bar chart to toggle the view between race/ethnicity, age, and gender. -
Outcome Measure and Demographic Characteristics
These small boxes display outcomes and demographic characteristics for clients with the selected housing status. The data in these boxes can be viewed by race/ethnicity, age, or gender by selecting the relevant tab at the top of the screen.The first card presents the overall number of clients and outcome measure. The following boxes present the percentage of clients and the outcome measure in race/ethnicity, age, or gender categories. The boxes also present additional contextual information about the FPL, housing, and health care coverage of these specific populations.
This screen has three tabs that allows the view to be toggled and the charts to be viewed by race/ethnicity, age, or gender (see example below). Selecting a tab will update certain figures on the page.