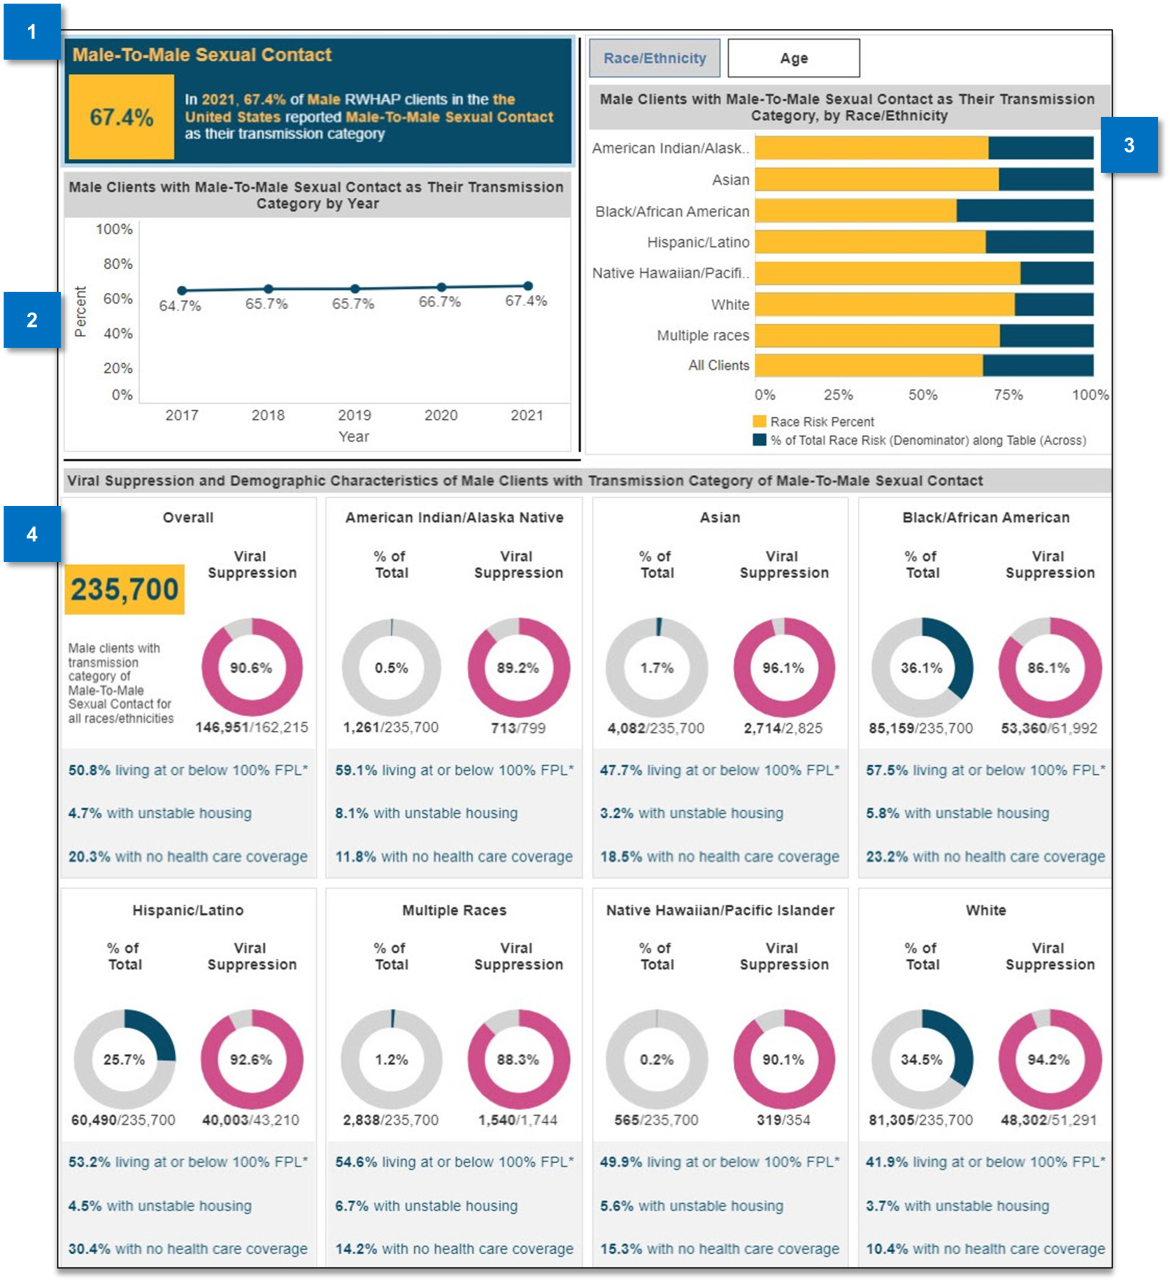
The Outcome Measures by Transmission Category screen (see Figure 10) shows viral suppression and retention in care by transmission category, as well as variations among priority populations.
When the screen first loads, it displays the most recent national data for viral suppression and male-to-male sexual contact. Select a Gender and Transmission Category from the dropdown menus to change the data displayed. The screen will automatically update based on the selections.
Figure 10
-
Transmission Category Summary
This box highlights the percentage of clients within the selected population who reported the selected transmission category. -
RWHAP Clients by Transmission Category by Year
This chart shows the percentage of clients within the selected population who reported the selected transmission category over a period of five years. -
RWHAP Clients by Race/Ethnicity and Age
These yellow bar graphs show the prevalence of the selected transmission category within the selected population. The tabs at the top change the view from race/ethnicity to age. -
Outcome Measure and Demographic Characteristics
These small boxes display outcomes and demographic characteristics for clients with the selected transmission category. The data in these boxes can be viewed by race/ethnicity, age, or gender by selecting the relevant tab at the top of the screen. The first card presents the overall number of clients and outcome measure. The following boxes present the percentage of clients and the outcome measure in race/ethnicity, age, or gender categories. The boxes also present additional contextual information about the FPL, housing, and health care coverage of these specific populations.
This screen also has two tabs that allow the views to be filtered by race/ethnicity or by age (see example below). Selecting either tab will update some of the figures on the page.