Social Media Evaluation Toolkit

This toolkit provides guidance and best practices on the evaluation of social media/media (SMM) campaigns. The information is meant to serve as a starting point for EHE jurisdictions to help you decide how best to measure the success of your SMM campaigns.

Below, we provide ready-to-use- tools, concrete examples of data metrics that you can expect to receive from your campaign as well as recommended best practices for how to use as well as supplement that data to evaluate your campaign’s success.

This information was gathered through TAP-in’s work with Ending the HIV Epidemic (EHE) jurisdictions and with support from our TA partners at UCLA and our partnerships with EHE jurisdictions that are implementing these campaigns.

Please note that with its focus on evaluation, this resource assumes that you have already determined the campaign goals and audience. If you have not already defined your campaign goals, and audience and would like technical assistance, please email us at [email protected]

Toolkit Components

Media Campaign Client Survey

Surveys for clients can be administered in clinic/agency settings to determine if the campaign influenced clients to seek care at the agency/clinic. The sample survey can be adopted to evaluate the reach and response to social and traditional media campaigns.

Download Media Campaign Client Survey


Media Monitoring Tool

Through our work with EHE jurisdictions on monitoring and evaluation of social media/media (SMM) campaigns, TAP-in developed some initial guidance and tools that can serve as a starting point for EHE-funded jurisdictions in planning for and implementing how they are going to track and measure success, impact, and opportunities to improve their EHE SMM campaigns.

Download Media Monitoring Tool (xlsx)

Media Campaign Evaluation Types and Metrics

  • Each campaign should have a web page, phone number, email, and/or text address to refer people to for more information or to schedule appointments. These endpoints should feature information that is presented in a client-centered approach and very clear about how to access services.
    • Traffic to these sources can be tracked to monitor reach and impact, such as the number of web page visits and unique IP address visits, number of phone calls, emails, and/or text messages.
  • With a short timeline, consider process monitoring:
    • Process monitoring involves metrics on inputs (e.g., number of ads placed or aired, duration billboard placements) and outputs (e.g., number of web page visits, phone calls, emails, text messages), but not impacts (e.g., number of clients entering or returning to care).
    • Send a template to each communications vendor to use in their final report
    • Ask for images of all campaign assets
  • With more lead time, consider expanded impact evaluation, including:
    • Clinic client survey questions related to recall of the campaign(s)
      • Questions on clients’ perceived impact of campaign(s)
      • See example client survey questions. The impact indicators from this could include:
        • Number of new clients citing campaign as a factor (or who recognized campaign)
        • Number of clients re-engaging with campaign cited as a factor (or who recognized campaign)
        • Viral load suppression rate of new or re-engaging clients who cited campaign as a factor
    • Compare clinic-level data on number of patients and appointments pre- and post- campaign, and in comparison to similar time periods in prior years. There is a lot of potential confounding in this approach, especially due to COVID-19, but it is another metric that may be informative.
  • Together, all of these approaches can be used to “triangulate” inferences on the potential impact of the campaign(s) individually and as a whole.

Analyzing Metrics

MetricNotes
Reach/ImpressionHow efficient that platform is for your audience
Click/ReachHow effective the message is
Engagement/ReachHow viral the message is
Spend/ClickThe cost of each action

Definitions

  • Campaign: Name or theme.
  • Dates: Dates the ads ran.
  • Engagements: Includes reactions, shares, and comments.
  • Goal(s): Awareness, Behavior (call, click, text), Outcomes (get tested, engage in care, reach viral load suppression).
  • Impressions: Number of times the post/ad was displayed. For website, use page views. For billboards radio, etc. use the number of boards/ads.
  • Intended audience: Demographic information about audience.
  • Platform: Social, digital, or conventional media space for campaign activity.
  • Reach: Number of people who saw the post/ad. For website, use unique users. For billboards, radio, etc. use available estimates.
  • Referrals/Clicks: Number of people who clicked for more info, etc. For billboards, radio, etc. use “for more info” call, text, website metrics.
  • Spend: Amount of budget to place ads/boost posts on this platform.
Media Campaign Evaluation Types and Metrics
  • Each campaign should have a web page, phone number, email, and/or text address to refer people to for more information or to schedule appointments. These endpoints should feature information that is presented in a client-centered approach and very clear about how to access services.
    • Traffic to these sources can be tracked to monitor reach and impact, such as the number of web page visits and unique IP address visits, number of phone calls, emails, and/or text messages.
  • With a short timeline, consider process monitoring:
    • Process monitoring involves metrics on inputs (e.g., number of ads placed or aired, duration billboard placements) and outputs (e.g., number of web page visits, phone calls, emails, text messages), but not impacts (e.g., number of clients entering or returning to care).
    • Send a template to each communications vendor to use in their final report
    • Ask for images of all campaign assets
  • With more lead time, consider expanded impact evaluation, including:
    • Clinic client survey questions related to recall of the campaign(s)
      • Questions on clients’ perceived impact of campaign(s)
      • See example client survey questions. The impact indicators from this could include:
        • Number of new clients citing campaign as a factor (or who recognized campaign)
        • Number of clients re-engaging with campaign cited as a factor (or who recognized campaign)
        • Viral load suppression rate of new or re-engaging clients who cited campaign as a factor
    • Compare clinic-level data on number of patients and appointments pre- and post- campaign, and in comparison to similar time periods in prior years. There is a lot of potential confounding in this approach, especially due to COVID-19, but it is another metric that may be informative.
  • Together, all of these approaches can be used to “triangulate” inferences on the potential impact of the campaign(s) individually and as a whole.

Analyzing Metrics

MetricNotes
Reach/ImpressionHow efficient that platform is for your audience
Click/ReachHow effective the message is
Engagement/ReachHow viral the message is
Spend/ClickThe cost of each action

Definitions

  • Campaign: Name or theme.
  • Dates: Dates the ads ran.
  • Engagements: Includes reactions, shares, and comments.
  • Goal(s): Awareness, Behavior (call, click, text), Outcomes (get tested, engage in care, reach viral load suppression).
  • Impressions: Number of times the post/ad was displayed. For website, use page views. For billboards radio, etc. use the number of boards/ads.
  • Intended audience: Demographic information about audience.
  • Platform: Social, digital, or conventional media space for campaign activity.
  • Reach: Number of people who saw the post/ad. For website, use unique users. For billboards, radio, etc. use available estimates.
  • Referrals/Clicks: Number of people who clicked for more info, etc. For billboards, radio, etc. use “for more info” call, text, website metrics.
  • Spend: Amount of budget to place ads/boost posts on this platform.
Metrics Directory

Links to help determine the metrics of various platforms. Some are direct from the platform companies (e.g., Facebook) while others are examples from firms or consultants that provide overviews on their webpages.

These resources are intended to provide summaries and frameworks to inform discussions and requests with the advertising providers on evaluation metrics.

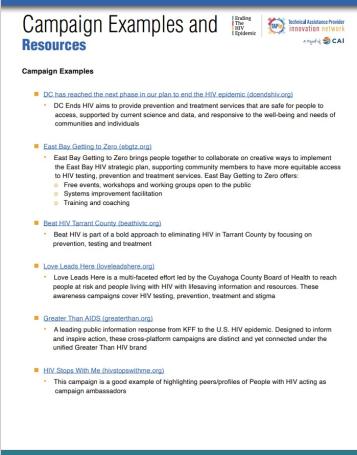
Campaign Examples and Resources

These campaign examples showcase different media campaigns.

  • DC has reached the next phase in our plan to end the HIV epidemic
    • DC Ends HIV aims to provide prevention and treatment services that are safe for people to access, supported by current science and data, and responsive to the well-being and needs of communities and individuals
  • East Bay Getting to Zero
    • East Bay Getting to Zero brings people together to collaborate on creative ways to implement the East Bay HIV strategic plan, supporting community members to have more equitable access to HIV testing, prevention and treatment services.
    • East Bay Getting to Zero offers:
      • Free events, workshops and working groups open to the public
      • Systems improvement facilitation
      • Training and coaching
  • Beat HIV Tarrant County
    • Beat HIV is part of a bold approach to eliminating HIV in Tarrant County by focusing on prevention, testing and treatment.
  • Love Leads Here
    • Love Leads Here is a multi-faceted effort led by the Cuyahoga County Board of Health to reach people at risk and people living with HIV with lifesaving information and resources. These awareness campaigns cover HIV testing, prevention, treatment and stigma.
  • Greater Than AIDS
    • A leading public information response from KFF to the U.S. HIV epidemic. Designed to inform and inspire action, these cross-platform campaigns are distinct and yet connected under the unified Greater Than HIV brand.
  • HIV Stops With Me
    • This campaign is a good example of highlighting peers/profiles of People with HIV acting as campaign ambassadors.
  • TAP-in Webinar – Use of Social Media and Mobile Technology as Essential Tools for EHE
    This TAP-in webinar highlights the products and best practices from HRSA’s Social Media/Mobile Technology Initiative that focused on young people with HIV who were not virally suppressed. It provides an in-depth look at 3 of the 10 funded projects and shares knowledge of both the challenges of and successful approaches to using social media.
  • Ryan White HIV/AIDS Program SPNS Initiative: Use of Social Media to Improve Engagement,Retention, and Health Outcomes along the HIV Care Continuum, 2015-2019
    • SPNS Social Media Initiative Demonstration Site Resources | TargetHIV
    • The Special Projects of National Significance (SPNS) Program initiative “Use of Social Media to Improve Engagement, Retention, and Health Outcomes along the HIV Care Continuum” implemented and evaluated innovative social media methods to identify, link, and retain HIV positive, underserved, underinsured, hard-to-reach youth and young adults (aged 13-34) in HIV primary care and supportive services. More information about the funded projects and related publications can be found using the above links.
  • Rigorously Using Evaluation Strategies to Improve Reach and Focus of New Media Outreach
    • This presentation from the NYC Department of Health and Mental Hygiene highlights approaches to evaluating media campaigns that utilize a range of social media and dating apps.
Social Media Reach in Atlanta > AIDS Campaign

Examples from the Atlanta>AIDS Campaign, an EHE-funded, geographically targeted social media campaign to improve engagement in HIV care that used a variety of social media channels.

Download Social Media Reach in Atlanta > AIDS Campaign

Campaign Overview

Goal: Encourage access and retention to care and treatment services for PWH by informing targeted
audiences of the availability of Ryan White HIV/AIDS Program (RWHAP) services.

  • Geographical reach of the campaign
    • Fulton, DeKalb, Cobb, Gwinnett Counties
  • Target Audience
    • People living with HIV (PWH) in high prevalence ZIP Codes
  • Media Platforms Utilized for the Campaign
    • Facebook, Grindr, Google Display Network, Google Search Ads, Instagram, YouTube
  • Campaign Website and Referral to Services Link
     

Evaluation Method

  • Using Data Triangulation methods where total several data sources were used so findings could be corroborated and any gaps or weaknesses in data could be compensated by completeness or strengths in other data sources.  HIV cases (total/prevalence and new/incidence) were available by County in this area.
     
    • The campaign’s YouTube analytics reported their metrics by zip code of users, which were aggregated to match the County level HIV prevalence and incidence data.
    • The campaign’s Website analytics reported metrics by cities of users, which were also aggregated to match the County level HIV prevalence and incidence data.
       
  • Calculating the View Rate
    • The view rate can be calculated using YouTube analytics by dividing the number of views by the number of impressions.
    • Calculating the Number of Website Sessions
      The total number of additional sessions can be calculated using Website analytics by subtracting the number of sessions from users. The number of additional sessions is an important metric to loosely gauge the level of interest in the material, as it represents the number of times viewers came back to the website after their initial visit.

Analytics Definitions

YouTube Analytics

  • Impressions: number of time video add displayed to users
  • Views: 30+ seconds of video add playing
  • View rate: percentage of views from people who saw the post/video
  • Clicks: number of times users clicked on add to get more information (e.g., campaign website)

Website Analytics

  • Users: Unique individuals/IP addresses visiting website
  • New Users: New unique users/IP addresses visiting website
  • Number of sessions: number of times people visit the website
  • Additional sessions: more than one visit to the website

How to Interpret Triangulated Data

There are many comparisons that can be made between and within counties or geographic areas with social media reach data.

For example, between counties or geographic areas, comparisons can inform where reach is lower to prioritize follow-up campaign foci. In the example, the YouTube “View Rates” indicate that Counties A and D have lower rates (31%) compared to Counties B and C (42% and 50%, respectively).

  • This might indicate a need to tailor future campaign activities to demographic characteristics of people with HIV in those counties. Comparisons might also be made in terms of Website Analytics (i.e., “Users”) proportional to the prevalent HIV cases in the area.

In the example, County A website users is a bit higher than total HIV cases (4,244 vs. 3,457), County B has more than 3x as many users and people with HIV (52,265 vs. 16,114), County C has about 1/3 the users as people with HIV (3,231 vs. 9,901), and County D has about twice the number of website users as people with HIV (7,315 vs. 3,557).

  • These indicators suggest areas for targeting media campaigns that might increase website visibility and usage.

Within counties or areas, comparisons can also be made between different social media channels, such as YouTube vs. Website. In the example below, County B has the second highest YouTube view rate (41%) but the lowest website users (about 1/3 of diagnosed people with HIV), while County D has the lowest YouTube view rate (31%) but second highest proportion of website users to people with HIV. This information might inform the different social media teams or vendors about more localized tailoring or targeting for their activities.

We'd like your feedback

Was this page helpful?
I found this page helpful because the content on the page:
Check all that apply
I did not find this page helpful because the content on the page:
Check all that apply
Please include an email address if you would like a response
Did you use this approach in your work?
Not yet because
If no, why not?