The Characteristics of Ryan White HIV/AIDS Program Clients screen (see Figures 4 and 5) displays characteristics and demographics of the clients served by RWHAP. The initial view for this screen shows the most recent national data for all the RWHAP clients. You can also view national, state, or metropolitan area data.
Figure 4
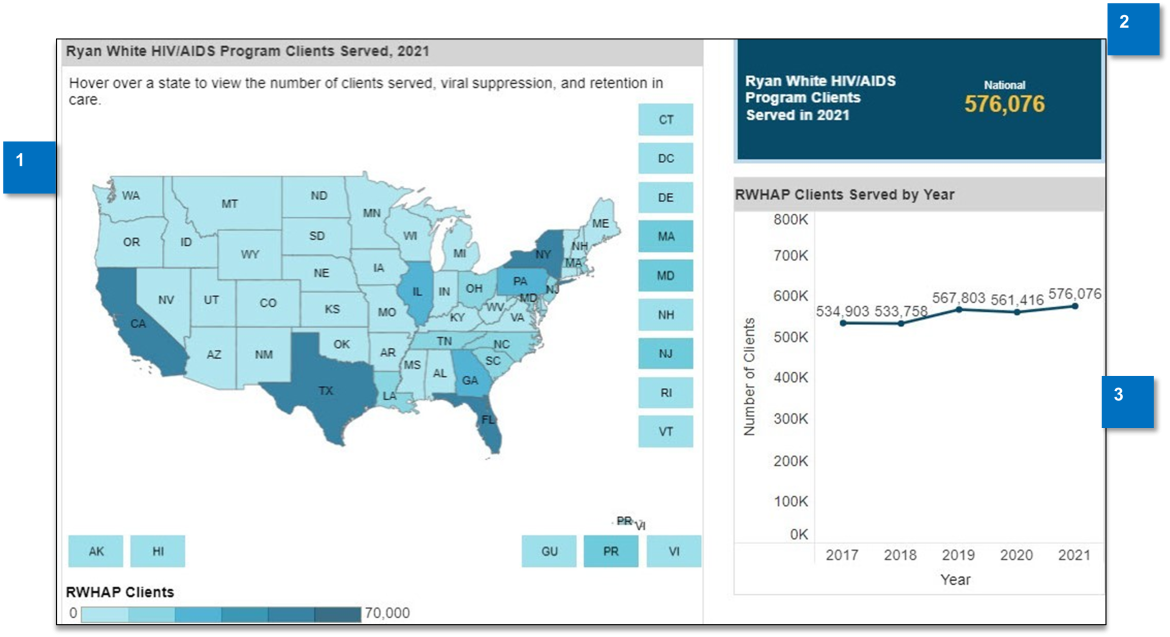
-
RWHAP Clients Served Map
This map shows national or state-level information about RWHAP clients for the selected year. -
RWHAP Program Clients Summary
This presents the number of RWHAP clients served in the selected location. -
RWHAP Clients Served by Year
This graph shows the number of clients served in the selected location over a five-year period.
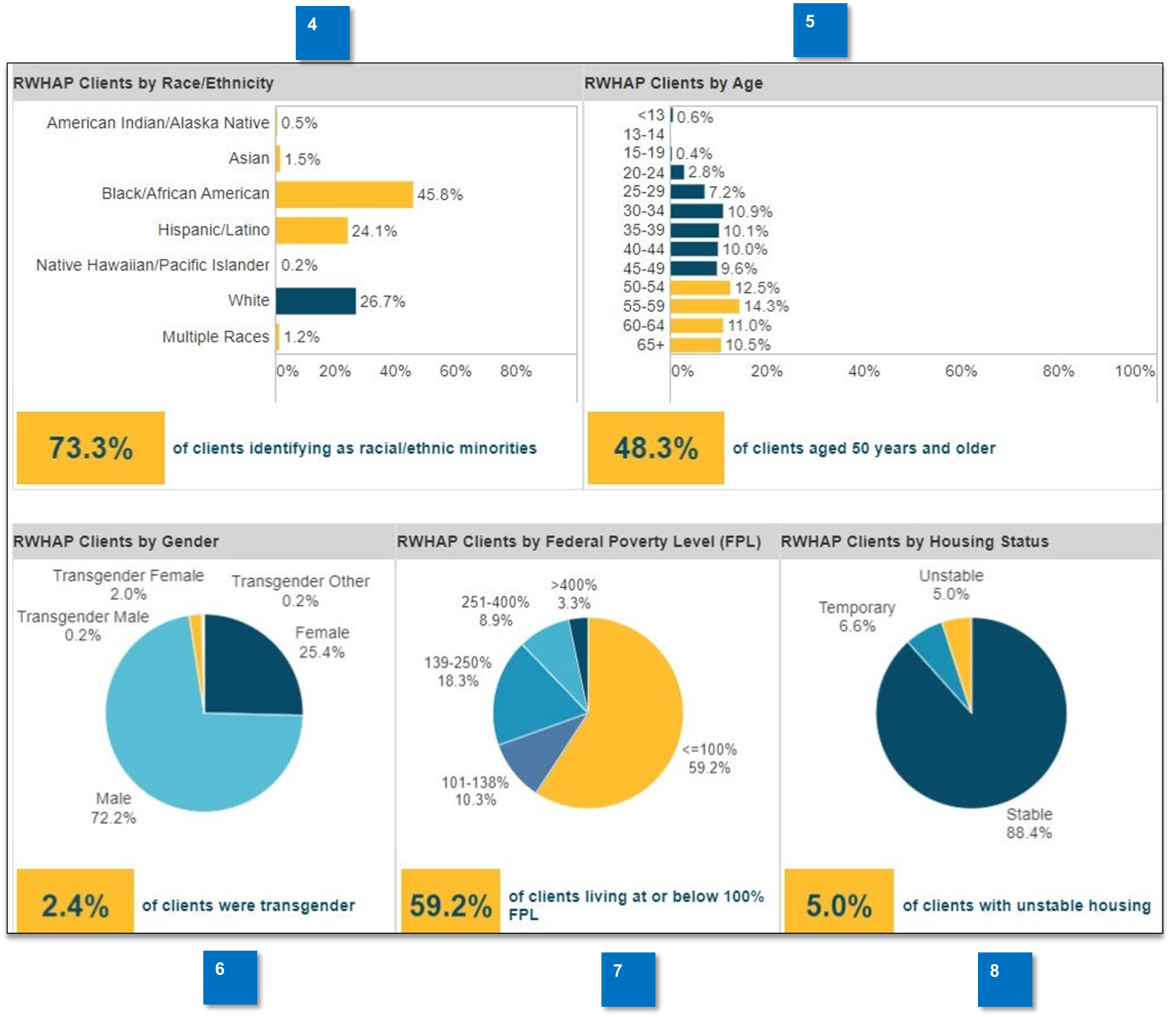
Figure 5
-
RWHAP Clients by Race/Ethnicity
This bar chart shows the percentage of clients in each race/ethnicity category. Racial/ethnic minorities are indicated by yellow bars, and the total percentage of clients that are racial/ethnic minorities is displayed below the bar chart. -
RWHAP Clients by Age
This bar chart shows the percentage of clients in each age group. Age groups within the aged 50 years and older category are indicated by yellow bars, and the total percentage of clients that are aged 50 years and older is displayed below the bar chart. -
RWHAP Clients by Gender
This pie chart shows the distribution of client gender. Transgender clients are represented by the yellow slice. The total percentage of transgender clients is displayed below the pie chart. Transgender clients may include transgender male-to-female (MTF), transgender female-to-male (FTM), or transgender other. -
RWHAP Clients by Federal Poverty Level
This pie chart shows the distribution of income level as a percent of Federal Poverty Level (FPL). Clients living at or below 100% FPL are represented in yellow. The total percentage of clients at or below 100% FPL is displayed below the pie chart. -
RWHAP Clients by Housing Status
This pie chart shows the percent distribution of housing status for RWHAP clients. Clients with unstable housing are represented in yellow. The total percentage of clients with unstable housing is displayed below the pie chart.