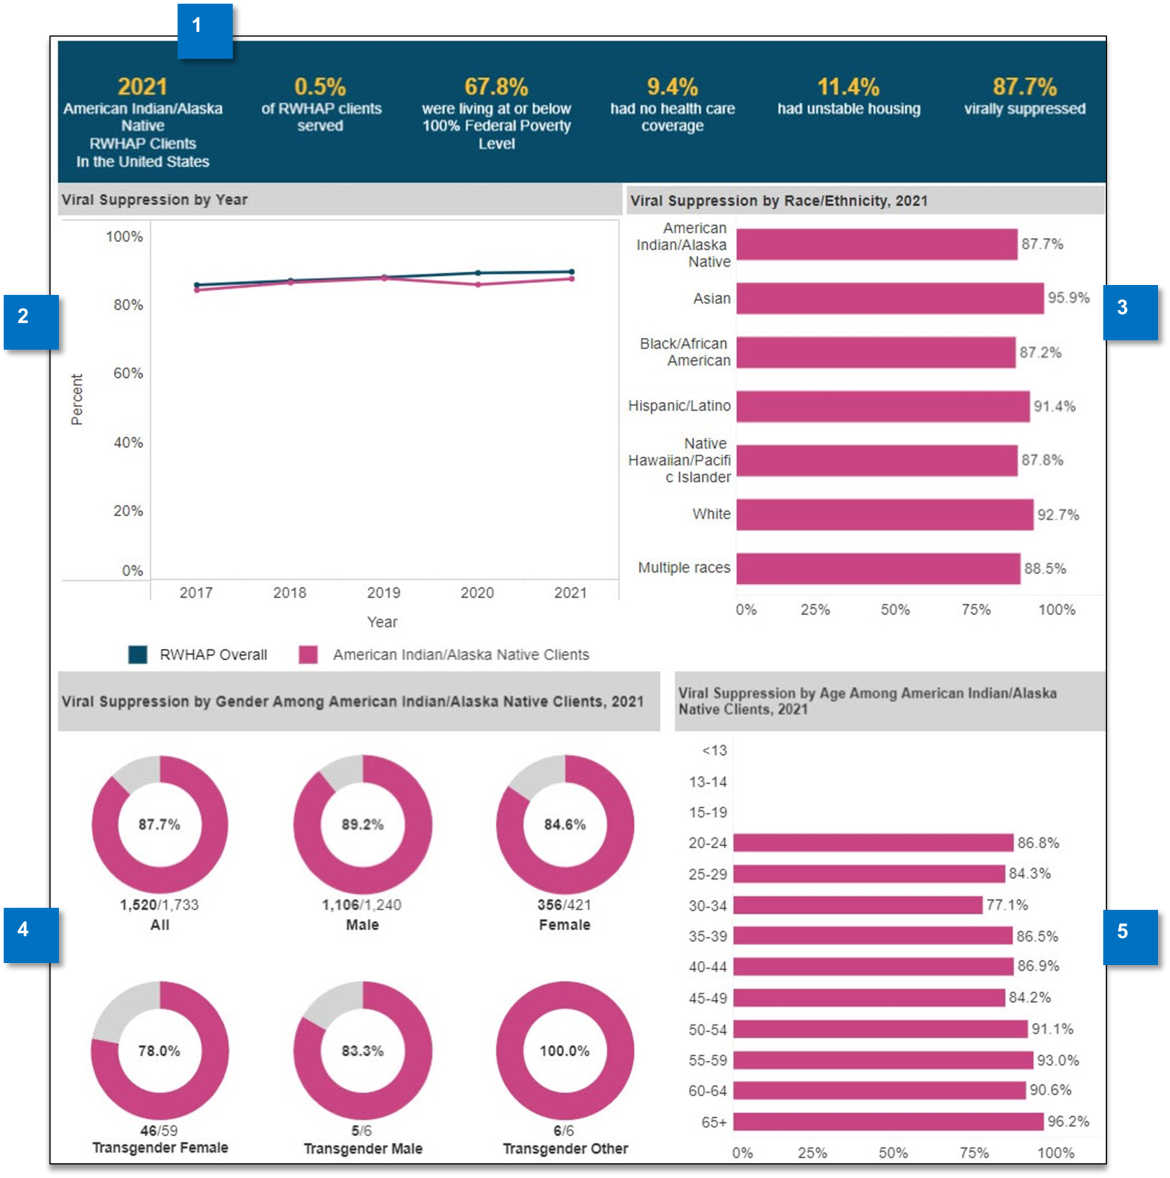
This screen (see Figure 8) displays viral suppression or retention in care by client’s race/ethnicity. When the screen first loads, it displays the most recent national data for viral suppression among White clients. Select a different race/ethnicity from the dropdown menu to change the display.
Figure 8
-
Summary Information
This block contains key contextual information for the selected race or ethnicity.-
Percent of Client Population: The percentage of clients that identify as the selected race/ethnicity.
-
At or Below Federal Poverty Level (FPL): The percentage of clients living at or below 100% FPL for the selected race/ethnicity.
-
No Health Care Coverage: The percentage of clients with no health care coverage for the selected race/ethnicity.
-
Unstable Housing: The percentage of clients with unstable housing for the selected race/ethnicity.
-
Outcome Measure: The percentage of clients that meet the selected outcome measure for the selected race/ethnicity.
-
-
Outcome Measure by Year
The magenta trend line shows the selected outcome measure over a five-year period for the selected race/ethnicity category. A trend line for the national data for all race/ethnicity categories is plotted in dark blue for comparison. -
Outcome Measure by Race/Ethnicity
This bar chart shows the outcome measure (i.e., viral suppression or retention in care) by race/ethnicity categories. -
Outcome Measure by Gender
This bar chart shows the outcome measure (i.e., viral suppression or retention in care) by gender for the selected race/ethnicity category. -
Outcome Measure by Age
This bar chart shows the outcome measure (i.e., viral suppression or retention in care) by age for the selected race/ethnicity category.